Building Browsers
Although massively complex entities, web browsers are just software projects like any other. Thankfully, both browsers we cover in this training are completely open source, which makes our lives much easier for two major reasons:
- We can download and build our own copies to debug
- We don't have to reverse engineer the browser binaries
Compiling any large piece of software from source can often be a daunting process. We will walk through the how and why of building these browser engines out of their respective repositories, highlighting things that are particularly relevant or helpful in the context of vulnerability research.
NoteThe VM we provide has everything prebuilt, so performing a build yourself is not necessary for this training. Nevertheless, understanding the build process and general project structure covered here provides very useful context.
For practical experience, you can optionally follow along on the VM for building the standalone JavaScript interpreters (there will not be enough disk space for full browser builds). Details will follow in the relevant sections.
This page can also be a good reference if you decide to build on your own machine at some point. However, be warned that even on significantly powerful hardware, a full browser build may take hours. Plenty of disk space will also be required (e.g. 200GB+). The standalone JS interpreters will be quicker / smaller, but are still large projects.
Build Flavors
There are two relevant build types to focus on:
release and debug. Although both are technically composed of the same code, the
configuration differences are significant enough that you will almost certainly want
one over the other depending on the task at hand.
Release Build
The release build is essentially identical to what actually gets "shipped" to consumers as
official builds. When you download Chrome on a fresh machine, you are essentially downloading a
Chromium-build compiled under release mode with some platform and vendor specific tweaks.
The priorities of release mode are to provide a positive, consistent user experience across
as many supported devices as possible. To this end, binaries in release mode have the following
properties:
- Stripped of all symbols (smaller binary size)
- More aggressive compile-time optimizations
- No debug asserts / other sanity checks
This makes the binaries much smaller and faster for end-users.
Debug Build
As opposed to the release build, debug builds are meant primarily for developers.
Generally, debug builds trade performance for having access to a large
amount of verbose, contextual information about the process available at all times.
Debug builds will typically have:
- Large binaries
- Typically full symbols/debug info will be available
- Extra code/features unique to debug mode
- Debug asserts compiled in
- Only conservative optimizations enabled
A debug build will likely run significantly slower, but can be very useful for (exploit) development.
Building Chromium
This section will walk through the process of building Chromium while providing commentary on adjacent, but relevant, topics.
Official build instructions for various platforms can be found in the Chromium docs.
Before beginning a browser build, make sure you have a good chunk of free space available, web browsers are massive projects.
Some example disk usage numbers:
               full Chromium
(shallow clone) source         18G
  +default git history   +59G  77G
         +dependencies    +5G  82G
          +debug build   +35G 117G
        +release build    +6G 123G

               V8 standalone
(shallow clone) source          2G
  +default git history    +2G   4G
         +dependencies    +1G   5G
          +debug build    +5G   9G
        +release build   +.3G  10G
Chromium - Code Locations
Before we build anything, we'll show you where developers actually fetch the latest code from. The Chromium project primarily revolves around:
which holds the git-based source trees for Chromium and V8 (its JavaScript engine), among other projects:
There is also a mirror of V8 on GitHub:
It is important to note that this is far from a complete picture of the code that actually
runs when a user launches chrome.exe. During the build process, a significant amount of
external dependencies and/or components are pulled in depending on the exact build
configuration.
Chromium - Versions, Components, Dependencies
Becoming familiar with the logistics of identifying and obtaining the relevant code for a particular sub-component of a browser is an invaluable skill. There are nearly 400 dependencies/components in the Chromium project. Being comfortable working in this sort of environment will make every other part of vulnerability research a bit easier and less taxing.
Finding Chromium Versions
The most logical place to start is finding the exact version of an already running Chrome instance.
If you have a copy of Chrome or Chromium, and type about:version into the URL bar, you will see something similar to:
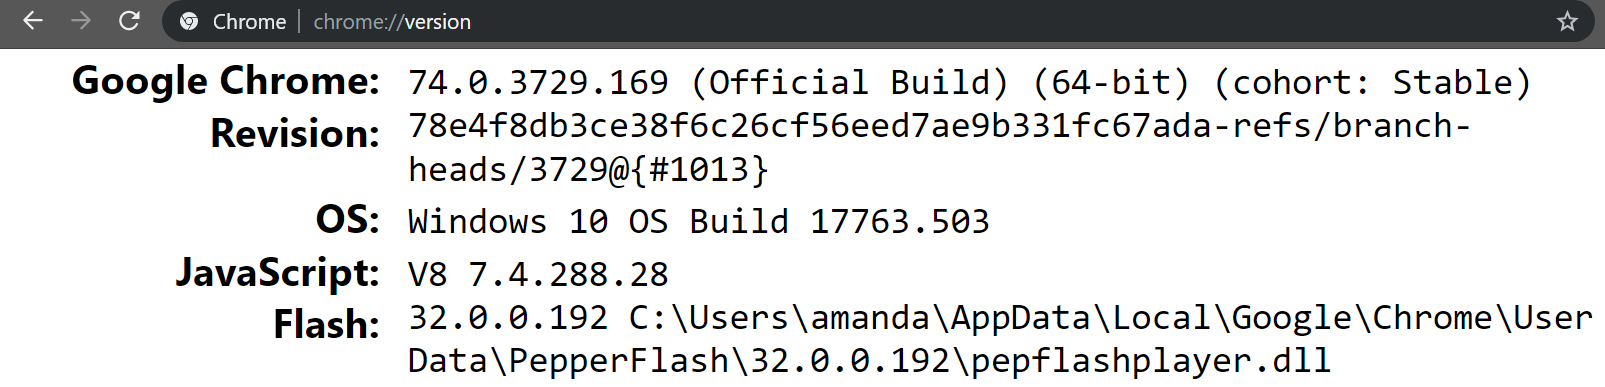
This is a very convenient way to get the exact version information for a pre-existing build.
However, there may be times when you want to look at the code for other versions of a particular component. How can you be sure which versions of each component are in use by a given Chrome version?
Finding Chromium Versions - DEPS
The DEPS file lists which version of each component a specific Chromium version uses. This is always a top level file in the source tree:
This lets us identify versions of dependencies for any given Chromium version.
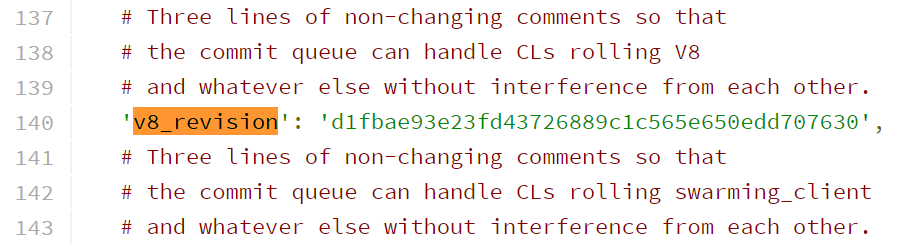
For example, imagine we were interested in reimplementing a JavaScript exploit for some older version of Chromium. We would navigate to the DEPS file for that version, then look for v8, Chromium's JavaScript engine:
Another practical (albeit 3rd-party) tool for this purpose was OmahaProxy. It has been superseded by ChromiumDash, which currently lacks the relevant functionality. Some older research blogs or browser exploitation resources may still reference OmahaProxy.
Chromium - Getting the Code
The first step in building Chromium is actually obtaining the relevant source code. To simplify the build process, Google provides a repo of tools to help pull and build the project, called depot_tools. You can reference this how-to page for installation.
Once you have depot_tools, the following one-liner can be used to actually grab the code:
bashmkdir chromium && cd chromium && fetch --nohooks chromium
And if you want to check out a specific version:
bashcd src && git checkout <version number>
gclient sync
An important caveat: You must run gclient sync whenever you change versions.
Chromium - Building Dependencies
Now that we have the relevant code, we can properly begin the build process. The first step will be to install and build dependencies, which can be kicked off with the following commands:
bash./build/install-build-deps.sh
gclient runhooks
Once those commands finish, we are ready to configure our Chromium build. This step will allow us to pick and choose exactly which features we want compiled into the build.
Chromium - Build Configuration
To generate the build configuration, we will use GN provided by depot_tools,
which generates files for the ninja build system.
To quickly generate a default build configuration:
bashgn gen out/Default
This creates a directory out/Default holding all the build files.
To specify build arguments:
bashgn args out/Default
To list all possible arguments you can use the following:
bashgn args out/Default --list
As you may have guessed, there are a lot of configurable bits and bobs when building a browser engine.
Notably, is_debug determines if the build will be debug or release mode:
is_debug=[true|false] # Change the build type to debug or release
symbol_level=[0|1|2] # Change how many symbols are included
blink_symbol_level=0 # Include to remove blink symbols
...
Chromium - Building
Once we've created a build configuration using GN as described in the previous section, we are ready to kick off a full Chromium build.
We are interested in building the chrome target:
bashninja -C ./out/Default/ chrome
This will take a long time, but once complete, you should be able to run the binary at out/Default/chrome.
For faster builds, it's possible to set up a distributed build system using reclient and a compatible server to distribute builds across workers (for historical context, Google's previous now-deprecated distributed build system was Goma). It may be a pain to set up, but is something to be aware of if you plan on having to rebuild Chrome frequently.
For reference, the process we've covered all in one snippet:
bash# Download the code
mkdir chromium && cd chromium
fetch --nohooks chromium

# Check out specific version
cd src && git checkout <version number>
gclient sync # Run anytime you change versions

# Dependencies
./build/install-build-deps.sh
gclient runhooks

# Configuration
gn gen out/Default
# optionally specify args
gn args out/Default

# Trigger build or rebuild
ninja -C out/Default chrome

# Run Chrome
./out/Default/chrome
Prebuilt Chromium
Google hosts CI builds of Chrome here.
Not every commit will have its own dedicated snapshot, but the list is updated frequently and can be a low-friction way to quickly obtain a specific build.
You can download a text file containing the latest revision number here,
then filter for that revision. The REVISIONS file in each snapshot includes version information for various components:
json{
   "chromium_revision" : "1272700",
   "got_revision" : "1db34624bdb4073161c92d32bad0a4496f63d428",
   "got_revision_cp" : "refs/heads/main@{#1272700}",
   "got_v8_revision" : "a97d6e3cd52274ddd42b2d04d6d26468d1b99f83",
   "got_v8_revision_cp" : "refs/heads/12.4.238@{#1}",
}
Google provides ASAN builds as well.
Chromium - Building V8 Exclusively
Building the entirety of the Chromium project is expensive, inconvenient, and often unnecessary. In many cases, all we need is a standalone JavaScript interpreter, given that a majority of modern browser vulnerabilities arise from the JavaScript engine.
The process for V8 is relatively similar to building full Chromium:
bash# Download the code
mkdir v8 && cd v8
fetch --nohooks v8

# Check out specific version
cd v8 && git checkout <version number>
gclient sync # Run anytime you change v8 version

# Dependencies
./build/install-build-deps.sh

# Trigger build or rebuild
# (gm.py wraps gn + ninja)
tools/dev/gm.py x64.release
# or
tools/dev/gm.py x64.debug

# Run the V8 REPL
./out/x64.release/d8
# or
./out/x64.debug/d8
Changing build options and generating a build file is done with GN, just like before:
bashgn args ./out/x64.release
BUILD.gn lists all the options, or you can use gn args --list <dir>.
For example:
v8_enable_pointer_compression = false
Building V8 Exercise (Optional)
Building WebKit
The process of building WebKit is conceptually similar to Chromium. Overall, WebKit is more compact, but it is still a good idea to budget a sizable chunk of disk space for it.
Some example disk usage numbers:
            macOS full WebKit
(shallow clone) source        6G
  +default git history   +9G 15G
          +debug build  +24G 39G
        +release build  +29G 68G

             Linux jsc-only
(shallow clone) source        6G
  +default git history   +9G 15G
          +debug build   +5G 20G
        +release build  +.4G 21G
WebKit - Code Locations
WebKit originally used Subversion (SVN) for development, but has since transitioned to git:
In Safari, you can find version information in the "About Safari" menu:
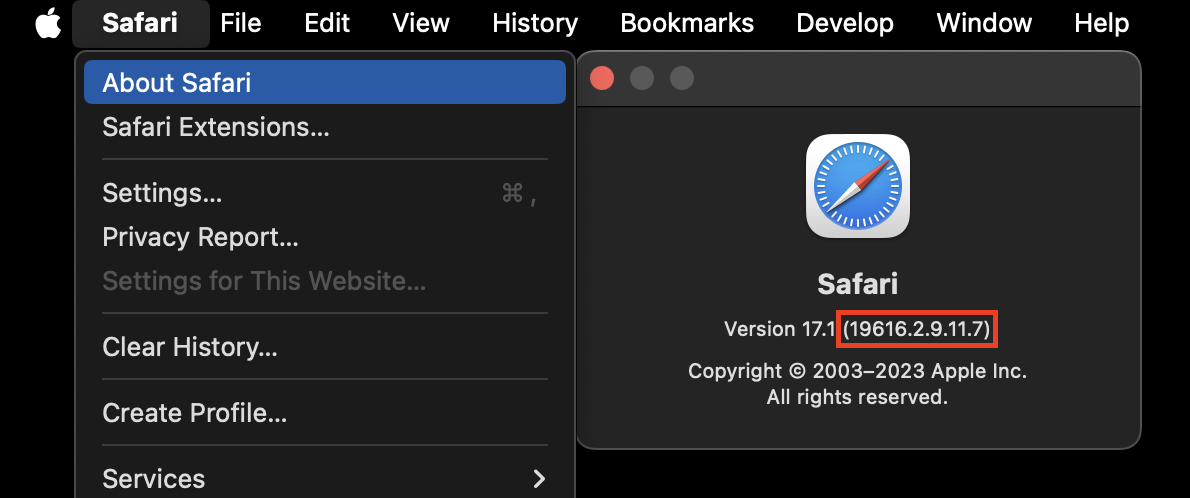
The first two digits are hardware-dependent, while the rest indicate the WebKit version.
You can then search for tags with that version, e.g. the 616.2.9.11.7 version in the image above
corresponds to the WebKit-7616.2.9.11.7 git tag.
WebKit - Getting the Code
Getting the WebKit code is a bit simpler, as it's just vanilla git:
bashgit clone https://github.com/WebKit/WebKit.git
WebKit - Building on macOS
Once you've obtained the code, building is quite simple, especially on macOS. WebKit includes a collection of scripts that allow for quick configuration and building:
bash# note: building requires Xcode + command-line tools (xcode-select --install)

# Configure
Tools/Scripts/set-webkit-configuration --debug
Tools/Scripts/set-webkit-configuration --release

# Build (can also specify --debug or --release here)
Tools/Scripts/build-webkit

# Launch Safari but load our build of webkit libraries (https://webkit.org/running-webkit/)
Tools/Scripts/run-safari

# Use minibrowser wrapper instead of Safari (better for old versions)
Tools/Scripts/run-minibrowser
This will result in building the full WebKit project, similar to building the entirety of Chromium.
This will additionally build minibrowser, a barebones browser GUI that wraps WebKit.
MiniBrowser can be especially helpful for running older WebKit versions which may be impossible
to force-load into an up-to-date Safari.
WebKit - Building on Linux
Safari is a macOS application, while this training (and much of vulnerability research) is frequently conducted on Linux. Ultimately, the code that we are interested in is mostly cross-platform, but there are a few Linux-specific compilation quirks that are good to know.
First, we need to install additional dependencies for the "GTK port" of WebKit:
bashTools/gtk/install-dependencies

# Building deps (takes a while but good for debugging)
WEBKIT_JHBUILD=1 Tools/Scripts/update-webkitgtk-libs

# OR use prebuilt flatpak (fast but container is bad for debugging)
Tools/Scripts/update-webkitgtk-libs
NOTE: Without JHBUILD, GTK WebKit will use Flatpak, which breaks some gdb features. However, there may be issues building with JHBUILD if Wayland is installed.
With dependencies out of the way, we can actually kick off the build:
bash# Chose a build mode
Tools/Scripts/set-webkit-configuration --debug # for debug
# OR
Tools/Scripts/set-webkit-configuration --release # for release

# Build without sandbox to make debugging easier
Tools/Scripts/build-webkit --gtk --no-bubblewrap-sandbox
Once this completes, we can run MiniBrowser using the following command:
bashTools/Scripts/run-minibrowser --gtk --debug <url>
NOTE: If you are using Flatpak, this will run in a container.
WebKit - Building JavaScriptCore Exclusively
For the same reasons we may want to probe at a standalone version of V8, we will often want to poke at
JavaScriptCore (JSC) on its own. The process of building JSC is very similar to a regular WebKit build, with the
addition of the --jsc-only flag.
bashTools/Scripts/set-webkit-configuration --debug # for debug
Tools/Scripts/set-webkit-configuration --release # for release

Tools/Scripts/build-webkit --jsc-only

# Run the JSC REPL
./WebKitBuild/JSCOnly/Debug/bin/jsc
./WebKitBuild/JSCOnly/Release/bin/jsc # for release
# or on macOS, wrapper to set DYLD_FRAMEWORK_PATH
Tools/Scripts/run-jsc --jsc-only [--debug] [--release]
WebKit with AddressSanitizer
AddressSanitizer is a tool that helps detect "memory errors". More specifically, it is a compile-time LLVM pass that does extensive bookkeeping about the state of the current program's address space. By querying this bookkeeping, AddressSanitizer (usually abbreviated ASAN) can detect many memory corruption bugs that would otherwise go unnoticed.
Most of the time, running an ASAN build will be very slow and memory-intensive, but it can be an invaluable feature for debugging, fuzzing, and general research. To kick off an ASAN build you can try the following:
bashTools/Scripts/set-webkit-configuration --asan --debug
Tools/Scripts/build-webkit --gtk --cmakeargs="-GNinja" MiniBrowser
NOTE: Must be done on a fresh WebKitBuild directory to apply correctly.
Building JSC Exercise (Optional)
Code Browsing
This training, and vulnerability research in general, involves reading, navigating, and ultimately understanding a lot of code.
Every researcher has their own unique preferences when it comes to the ergonomics of reading source. However, there are a number of useful technologies we believe everyone should be aware of and consider integrating into their workflow when working with source trees as large as a web browser's.
Language Servers
Language Servers are programs that consume source code to create a query-able database containing all sorts of language-informed metadata about a project. They enable things like following symbols, finding cross references, code-completion, following class inheritance, and much more.
Typically, you would run a language server and then "connect" to it via an editor plugin. Both projects below are worth taking a look at, especially if you are someone who typically prefers to work inside an editor like VIM or EMACS as opposed to traditional IDEs.
Web-Based Browsers
These websites are specifically generated for the Chromium and WebKit projects. They provide a quick and easy way to navigate code, jump between definitions and references, etc.
Woboq can be used for other projects as well.
Introduction to Debugging
Although web browsers are just executables at the end of the day, debugging them comes with some unique challenges:
- Attaching to the correct process
- Finding/debugging the correct thread
- Getting a "lay of the land" of the address space
For this training, we will be using GDB with pwndbg the majority of the time. You can use the cheatsheet below as a quick reference if you are unfamiliar with GDB commands: GDB Cheatsheet.
Generally, standard debuggers are used for browser research, with some convenience or helper plugins to suit:
Finding the Correct Process
The first step in debugging the browser is to actually attach the debugger to the correct process. Both Chrome and Safari use a multiprocess model as described in the previous module.
Chrome - Finding the Correct Process
There are two methods for finding the relevant PID:
- Use Chrome's internal task manager (shift+escape)
- Start with the following flags:
--no-sandbox --renderer-startup-dialog --disable-hang-monitor
Below is what attaching would look like using the second method:
[10506:10506:0904/174115:2537132352130:ERROR:child_process.cc(131)]
Renderer (10506) paused waiting for debugger to attach. Send SIGUSR1 to unpause.


$ gdb -p 10506
(gdb) signal SIGUSR1
(gdb) c
Chrome - Faster Debug Symbols
Attaching to full debug chrome is very slow because of how gdb handles loaded symbols. One method of speeding this up is by splitting them out and using gdb to cache them: Chromium docs
Depending on the situation, it may even make more sense to debug a release build.
Safari - Finding the Correct Process
For Safari on macOS, you can use Activity Monitor and filter for "Safari". Each tab will be listed with its corresponding URL.
MiniBrowser - Finding the Correct Process
With MiniBrowser, we can see the difference between processes with ps fa:
 88 pts/0    Ssl+   0:00 /home/webkit/src/WebKit/WebKitBuild/Debug/bin/MiniBrowser
101 pts/0    SLl+   0:04  \_ /home/webkit/src/WebKit/WebKitBuild/Debug/bin/WebKitWebProcess
103 pts/0    SLl+   0:00  \_ /home/webkit/src/WebKit/WebKitBuild/Debug/bin/WebKitNetworkProcess
The process we are interested in is the first WebKitWebProcess:
bashpgrep WebKitWebProcess -f
We can also configure things such that gdbserver will spawn whenever we launch a new
WebKitWebProcess:
bashexport WEB_PROCESS_CMD_PREFIX='/usr/bin/gdbserver localhost:1234'
Tools/Scripts/run-minibrowser ...
Debugging with WebKit Flatpak
Newer WebKit versions use Flatpak for GTK MiniBrowser. This means
MiniBrowser will run in a container, so we need to run gdbserver inside the container:
bash#!/bin/bash
# Only works if you have a single tab in MiniBrowser and using flatpak 1.8.0+
sudo flatpak enter $(flatpak ps -v --columns=instance) \
    gdbserver --attach 127.0.0.1:1234 $(pgrep WebKitWebProcess -f -n)
bash# Attach with gdb in another terminal
$ gdb ./bin/WebKitWebProcess
(gdb) target remote localhost:1234
(gdb) continue
You can also find various other tips about debugging with MiniBrowser here:
GDB Debugging Scripts
JavaScript engines are extremely complex pieces of software. Both Chrome and WebKit ship GDB plugins which help automate common debugging tasks and inform GDB about certain data-structures and other attributes present in the project.
Although not strictly necessary, having these enabled can be helpful.